Decreasing Agency Balance Sheet Value: A Positive Impact?
Despite significant optimism about key market fundamentals, year-over-year agency valuation increases and agency performance metrics, ownership perpetuation continues to be the biggest long-term challenge to independently-owned insurance agencies, according to the MarshBerry 2013 Market & Financial Outlook Survey.
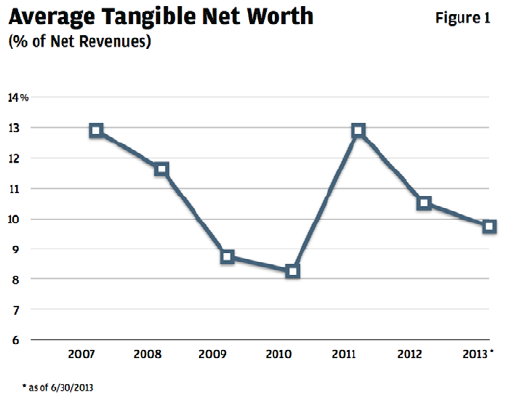
The survey also found that despite the strongest (revenue) growth in recent history and a significant percentage of agency owners indicating higher profitability, agency balance sheets, as measured by average tangible net worth, dropped as a percentage of net revenues in 2012 — and continues to drop into 2013 (See Average Tangible Net Worth in Figure 1).
In June, MarshBerry launched the 28th Annual Market & Financial Outlook Survey in conjunction with Insurance Journal. The survey compiled anonymous general independent agency information along with financial, market, carrier and technology data. The survey results indicate there is an optimistic outlook for the insurance industry. For most lines of business, commission income is growing, and the survey respondents expect profits to be similar or better in 2013 compared to 2012.
Decline in Tangible Net Worth
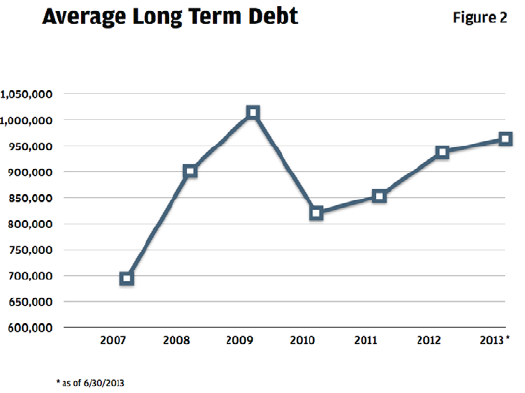
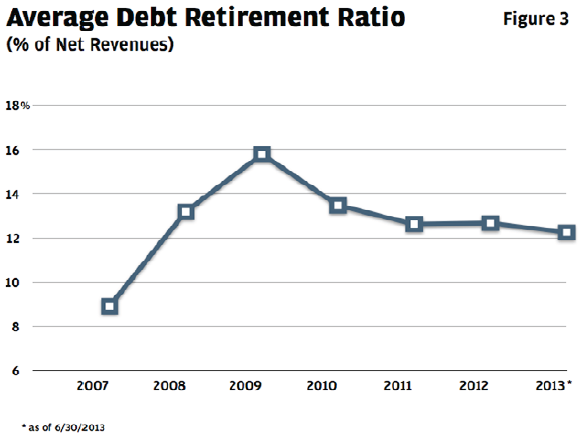
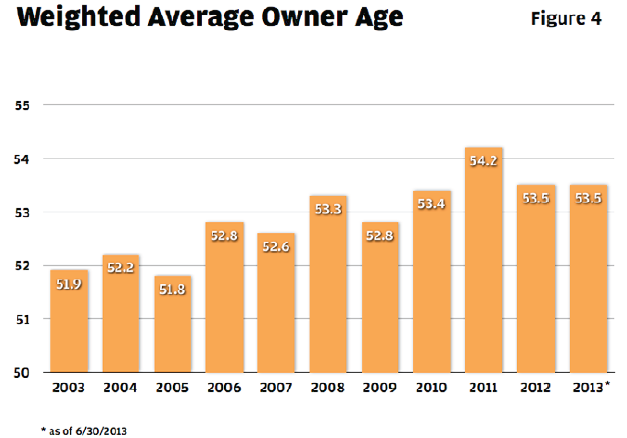
Taking a more granular look at the potential driving forces behind the decline in average tangible net worth, the survey revealed the following trends.
The decrease in agency balance sheet value, while seemingly negative at face value, may be an indication that agencies are taking advantage of positive market conditions — including low interest rates and available external financing — to reinvest in their agency, whether it be for acquisition growth and/or perpetuation of ownership through an internal sale. If this is the case, agencies should strive to maintain a tangible net worth ratio of 15 percent to 20 percent of revenues. Whether the goal is to perpetuate internally or grow through acquisitions, a strong balance sheet is often both necessary and beneficial.
Agencies should carefully consider the use of cash and debt leverage to determine how to best enhance growth, profitability and perpetuation of ownership, and remain a viable force in the distribution system.
The 2013 Market & Financial Outlook highlights these areas and others including:
- Key agent and broker performance trends from 2007-2014 with results segmented by revenue size and region;
- Largest threat to agency growth;
- Carrier partner strengths;
- Five-year expense trends — Compound Annual Growth Rate (CAGR); and
- Staffing trends.
Respondents that completed the survey and provided contact information will receive a link to download the complete report on Oct. 23, 2013. The complete report will be available for purchase online on Oct. 23 via www.MarshBerry.com for $199. Visit http://info.marshberry.com/ExecutiveSummary to download the Executive Summary.
Source: The data is from a proprietary financial management system of Marsh, Berry & Co. Inc., Perspectives for High Performance (PHP). Agencies subscribe to the PHP reports and data from each subscriber is updated every quarter. The system calculates critical financial and productivity ratios and compares these ratios to the Average Performance in the group. Balance sheet ratios are averaged over a four quarter period.